Looking At St Mirren's Narrow Failure To Reach The Top 6
Looking At St Mirren's Narrow Failure To Reach The Top 6
After 33 games, played over 8 months in unprecedented circumstances, St Mirren fell short of the stated aim for this season - top 6 status - by 3 goals. Level on points with League Cup winners St Johnstone is no mean feat considering how impressive Callum Davidson has been in his rookie year as a manager; yet there's undoubtedly a lingering sense that the Buddies have let a very promising opportunity slip between their fingers. The league table, which is essentially a large spreadsheet, shows how tantalisingly close the two sides were but let's dig a little deeper behind the numbers.
Goalscoring
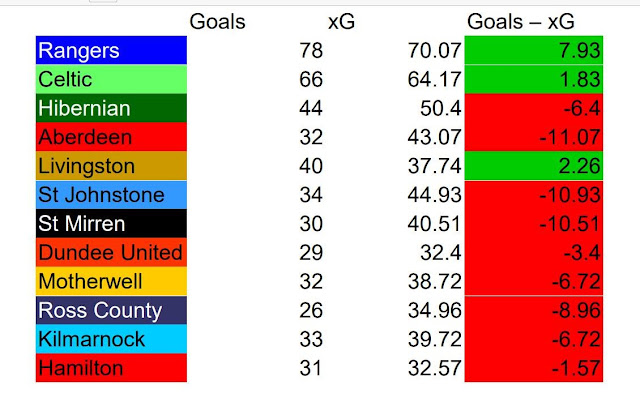
Goals For: St Johnstone 34 (6th best in division) St Mirren 30 (10th best in division)
If you've spent much time this season on social media, or discussing the team in person with other fans, you'll probably have noticed St Mirren supporters have a tendency to bemoan their lack of goalscoring prowess. Yet again, the most maligned position at the club is striker. The departure of Junior Morias was almost celebrated, news of Lee Erwin starting is continually greeted with howls of derision, and Jon Obika is certainly nowhere near fan favourite status either (despite several key goals and impressive displays throughout his spell in Paisley).
Unfortunately, the common consensus is the correct one here (as shown by Chart 1 below). St Mirren were profligate in their finishing and didn't convert enough chances to merit a top half berth. Not that St Johnstone, averaging barely over a goal per game, are going to be mistaken for Bayern Munich any time soon either; although they were far more successful at creating chances than us.
xG (incl. penalties): St Johnstone (4th best in division) 44.93 St Mirren (6th best in division) 40.51
All advanced metrics are taken from the brilliant ModernFitba unless otherwise stated. If you are unfamiliar with expected goals (xG), it is defined by ModernFitba as "Measuring the quality of the chances a team creates or concedes. We look at how many times each [type of] chance has been scored within our database of almost 300,000 attempts. If a specific chance has been scored 25% of the time, the xG is 0.25 for that chance." Further on this article, the same principles are applied again to examine expected goals conceded (xGC) and expected goal difference (xGD).
This additional insight reveals a lot about a team's underlying performance levels, while also serving as a useful indicator of future results. Interestingly, both St Johnstone and St Mirren underperformed their xG by a considerable margin and Livingston, despite outscoring both, would have been expected to score the fewest of the trio. It's unfortunate that the Almondvale side were the ones who joined the Old Firm in scoring more times than would be expected; ideally the third side to do so would have been Hibs or Aberdeen, whose blistering early season form meant they were virtually guaranteed top 6 by the New Year. The league was remarkably wasteful as a whole, with around half the sides underperforming by a remarkable amount.
Chart 1: xG Scottish Premiership 20/21 Credit to Modern Fitba & Ortec SportsDefence
Goals Against: St Johnstone 40 (6th best in division) St Mirren 38 (5th best in division)
Ever since Jim Goodwin took the reins in the summer of 2019, St Mirren have earned a reputation as being defensively sound, stodgy, and resilient. Players such as Jak Alnwick, Marcus Fraser, Richard Tait, and Conor McCarthy, regularly get showered with thoroughly merited praise. This is further supported by the fact St Mirren have conceded less often than direct rivals St Johnstone and Livingston in the league this season.
What is even more interesting, however, is that based on the opportunities opponents were able to create, it would be expected that St Mirren concede more often than the clubs from Perthshire and West Lothian. There's not necessarily a stylistic difference that can entirely explain this; none of the three sides were significantly more defensive or attacking than the others in strategic terms. The key factor in the Buddies favour was the brilliant Jak Alnwick, whose performances in between the sticks were a notable improvement on his counterparts (although justice for Max Stryjek, a far superior keeper than Robby McCrorie).
xGC (incl. penalties): St Johnstone 31.18 (2nd in division) St Mirren (7th in division) 46.43
Chart 2: xGC Scottish Premiership 20/21 Credit to Modern Fitba & Ortec SportsCallum Davidson was praised earlier in the article and the above table underlines his capabilities as a manager. St Johnstone are supremely well organised, tactically astute, and completely stifled us on both of our trips to McDiarmid Park. For them to be expected to - based on the chances of the opposition - have conceded fewer goals than Celtic after 33 games is superb (even allowing for the hot mess Celtic have been much of this campaign). The actual difference in goals conceded swinging so decisively towards Celtic is partly down to good fortune but mostly due to the inferiority of St Johnstone goalkeepers Zander Clark and Elliot Parish, who were two of the weakest in the division. This is an area which, after the league is settled, can be revisited during the end-of-season discussion.
Back to the real Saints, we've been unlucky at times - not least during the stretch of fixtures where none of our contracted goalkeepers were able to play due to coronavirus. The fiasco that ensued as a consequence hours before the 3-0 defeat to Hibs, with Bobby Zlamal eventually borrowed from Hearts, did send shockwaves that would permeate throughout that game and beyond. We subsequently embarked on a poor run of results; not that Zlamal was to blame for anything past his lacklustre debut, it's just an example of how the finest of margins have separated us from top half status.
As a natural conclusion to the piece, having discussed goals for and against, it makes sense to look at goal difference. St Mirren's status as 7th in the division, based on both actual goal difference and ModernFitba's expected goal difference (xGD), I feel accurately reflects our performance levels this season. The numbers shown thus far, plus doubtless many more measures, show that we've been hovering midtable, more often than not behind most, if not all, of the top half teams.
There's no question Hibs, Aberdeen, Livingston, and St Johnstone have all been streaky throughout this campaign; yet would anyone argue we've merited finishing above them? There's no question we could have with a bit more luck. To give another example of lady luck deserting us, those 8 games in February followed by a free weekend in the middle of March was cruel considering how weary and depleted our squad were by the end. However, any perceived injustice can serve as fuel to fire us to an even better season in 2021/2022.
And we might even be there to see the games by then!
Thanks for reading. St Mirren Till I Die.
Lewis.


Comments
Post a Comment